Visualize C++ Data Structures using Graphviz and the DOT language
Data structures help structure and organize data effectively, and provide several abstracted operations on the data. They are elegant and convenient, and computer scientists love to use them. Implementing these data structures in the computer require the programmer to flatten the structure into a one-dimensional model using pointers or references because the memory is actually arranged as a one-dimensional run of data elements.
It is often necessary to inspect the data structure in debugging and program verification phases. But some data structures happen to be particularly graphical, in that they have multiple associations and elaborate hierarchies or layers. Think of a Rope or a Graph. Due to many associations between nodes, it's not possible to properly display the graph on the terminal.
I recently ran into such problem, and found an interesting solution. In this post, I will try to document it. I've written mainly about the Abstract Syntax Tree in this post, but it should be trivial to translate it to any other deterministically traversable data structure.
I'm currently working on writing a compiler for my own Nepali programming language. The front-end part of a compiler converts the program code into a data structure called AST. AST, or Abstract Syntax Tree, is a tree-based representation of the source code. It's much more suitable to further transformations in the semantic analysis, optimization and code generation phases.

This picture of Abstract Syntax Tree taken from Wikipedia page on AST
But AST is also an incredibly complex data structure. It has to store a bunch of information and maintain a tree structure. It is not immediately obvious how one might present it on the terminal screen. Several ideas to exist, but they don't scale well. Two solutions that I thought up were:
- Print in the terminal
- Unparse the AST back to source code.
Unparse the AST back to source code
The AST is a lossless transformation of the source code as far as intent is concerned. So it should be possible to go the other direction and retrieve the source code back from the AST. If the AST doesn't have any errors, then it's unparsing should result in code that's nearly identical to the original source code. This step is also essential when trying to verify compiler correctness.
I'm going to have to explore this option further in the future. But because this method doesn't allow me to directly observe the AST at several stages of the compilation process, I didn't use this.
Print in the terminal
I had written a compiler for my minor project in my 6th semester but the language it accepted was very basic. So, back then, I got away with simply printing the tree in the terminal. For example, this code
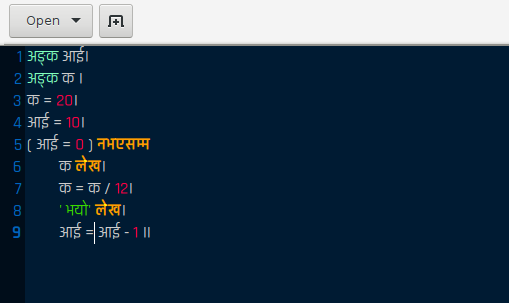
generates this AST:
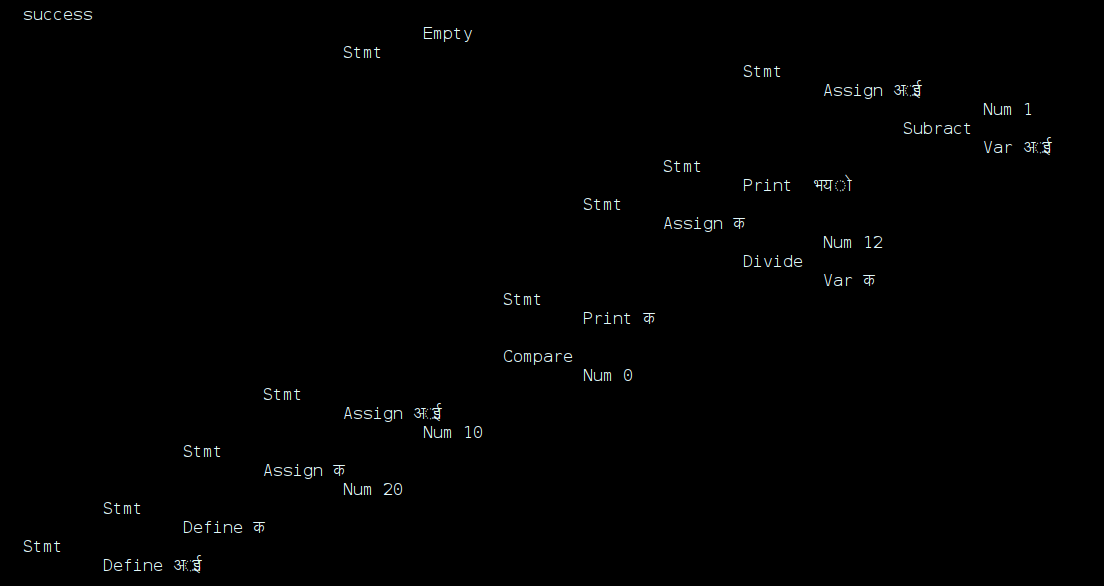
The AST is printed in the terminal rotated 90° counter-clockwise such that the root of the tree is at the bottom-left. This was served me well at the time. Frankly, for a language that didn't even have an else if clause, there's are limited ways to complicate the AST other than by writing longer code.
But the language I'm working on right now is extensive. And so the tree it creates is immense. I had to come up with some other way to analyse the AST.
Enter Graphviz
Brian Kernighan has given an amazing talk on successful language design, where he also talked about Pic, a language he designed for specifying graphs. I was immediately taken by the idea because this was a much better way to make graphs than the clumsy touchpad.
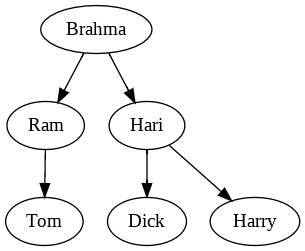
Well, Brian's Pic is antiquated now, but Graphviz does the same kind of thing. Graphviz uses the DOT graph specification language. DOT is extremely simple. It literally takes 5 minutes to be able to make nearly any graph you want. For example, consider the DOT code below
digraph any_other_name{
    Brahma->Ram
    Brahma->Hari
    Ram->Tom
    Hari->Dick
    Hari->Harry
}
It produces the Graph:
If you're interested, you should try some online Graphviz software to get the hang of it. I used this one but there are a lot of choices one web search away.
I can only imagine how many hours this thing could have saved me the previous semester when I was stuck making elaborate graphs for my minor project report and presentation.
Generating the DOT
Generating the DOT for Graphviz is generally trivial. For linked list, a recursive function such as the one below suffices (for c++):
void printElement(listElement* el, int nodeNumber){
  string DOT;
  DOT = "n" + to_string(nodeNumber) + " [label=";
  DOT+= el->name+"\"]\n";

  if (el->right){
    DOT += "n" + to_string(nodeNumber) + "->";
    DOT += "n" + to_string(nodeNumber+1) + "\n";
    printElement(el->right, nodeNumber+1);
  }
  cout << DOT;
}
It is a little more complex for the AST. Because trees are recursive structures,
it's easy to write elegant recursive functions that process the trees. In this
case, the genDOT(astNode,bool) function helps recursively descend the AST
tree, and print out it's nodes.
int rootNum = 0;
void Parser::genDOT() {
  cout << "digraph G{\n";
  cout << "graph[fontname=Rajdhani, color="#242038"]\n";
  cout << "node[fontname=Rajdhani, color="#242038", shape=square]\n";
  cout << "edge[fontname=Rajdhani, color="#242038"]\n";
  genDOT(root, false);
  cout << "}\n";
}

void Parser::genDOT(astNode &n, bool isLeft) {
  std::string print;

  // DOT for current node
  print = "n" + to_string(rootNum) + " [label=< <B>" +   translateTypeStr(n->type) + "</B>";
  if (translateDataStr(n) != "")
    print += "<BR/>" + translateDataStr(n) + " >";
  else
    print += " >";
  if (isLeft)
    print += ", color="#FF595E", fontcolor="#FF595E"";
  else
    print += ", color="#274690", fontcolor="#274690"";

  if (n->type == ast::astType::numericConstant ||
      n->type == ast::astType::stringConstant ||
      n->type == ast::astType::boolConstant) {
    print += ", shape=egg";
  }
  print += "]\n";
  int rootNumBackup = rootNum;
  rootNum++;
  if (n->type == ast::astType::_if) {
    if (n->cond) {
      print += "n" + to_string(rootNumBackup) + "->n" +
        to_string(rootNum) + " [label=condition]\n";
      genDOT(n->cond);
    }
    rootNum += 1;
    if (n->_if) {
      print += "n" + to_string(rootNumBackup) + "->n" +
        to_string(rootNum) + " [label=if]\n";
      genDOT(n->_if);
    }
    rootNum += 1;
    if (n->_elseIf) {
      print += "n" + to_string(rootNumBackup) + "->n" +
        to_string(rootNum) + " [label=elseif]\n";
      genDOT(n->_elseIf);
    }
    rootNum += 1;
    if (n->_else) {
      print += "n" + to_string(rootNumBackup) + "->n" +
        to_string(rootNum) + " [label=else]\n";
      genDOT(n->_else);
    }
    rootNum += 1;
  } else if (n->type == ast::astType::_while) {
    if (n->cond) {
      print += "n" + to_string(rootNumBackup) + "->n" +
        to_string(rootNum) + " [label=condition]\n";
      genDOT(n->cond);
    }
    rootNum += 1;
    if (n->_if) {
      print += "n" + to_string(rootNumBackup) + "->n" +
        to_string(rootNum) + " [label=do]\n";
      genDOT(n->_if);
    }
    rootNum += 1;
  } else {
    if (n->left || n->right) {
      if (n->left) {
        print += "n" + to_string(rootNumBackup) + "->n" +
          to_string(rootNum) + " [color="#FF595E"]\n";
        genDOT(n->left);
      } else {
        print += "n" + to_string(rootNum) + " [label=x]\n";
        print += "n" + to_string(rootNumBackup) + "->n" +
          to_string(rootNum) + "\n";
      }
      rootNum += 1;
      if (n->right) {
        print += "n" + to_string(rootNumBackup) + "->n" +
          to_string(rootNum) + " [color="#274690"]\n";
        genDOT(n->right, false);
      } else {
        print += "n" + to_string(rootNum) + " [label=x]\n";
        print += "n" + to_string(rootNumBackup) + "->n" +
          to_string(rootNum) + "\n";
      }
    }
  }
  cout << print << endl;
}
Of course, this is not the complete code. It only covers if and while loops, but not function bodies and other blocks. But this is the essence. Funnily enough, I spent less time writing code to actually generate the graph than I spent trying to make it look cooler. But given how much time I'm going to have to stare at and navigate these graphs, I think the it was worth the effort.
The rootNum keeps track of the parent node at each recursion. The parent node
needs to point to all it's the children, and rootNum helps keep track of the
that. The genDOT() function is simply the public interface which first prints
out the necessary DOT boilerplate and then calls the main genDOT(astNode,bool)
function. The genDOT(astnode,bool) function recursively prints out all the DOT
code. Here's the kind of DOT code it produces:
digraph G{
    graph[fontname=Rajdhani, color="#242038"]
    node[fontname=Rajdhani, color="#242038", shape=square]
    edge[fontname=Rajdhani, color="#242038"]
    n3 [label=< <B>Declare Var</B><BR/>नाम >, color="#FF595E", fontcolor="#FF595E"]
    n2 [label=< <B>chain</B> >, color="#FF595E", fontcolor="#FF595E"]
    n2->n3 [color="#FF595E"]
    n5 [label=x]
    n2->n5
    n1 [label=< <B>Declare String </B> >, color="#FF595E", fontcolor="#FF595E"]
    n1->n2 [color="#FF595E"]
    n6 [label=x]
    n1->n6
    n10 [label=< <B>dataEl</B><BR/>नाम >, color="#FF595E", fontcolor="#FF595E"]
    n12 [label=< <B>string</B><BR/>नीरब >, color="#274690", fontcolor="#274690", shape=egg]
    n9 [label=< <B>=</B> >, color="#FF595E", fontcolor="#FF595E"]
    n9->n10 [color="#FF595E"]
    n9->n12 [color="#274690"]
    n17 [label=< <B>string</B><BR/>नमस्ते मालिक >, color="#FF595E", fontcolor="#FF595E", shape=egg]
    n16 [label=< <B>chain</B> >, color="#FF595E", fontcolor="#FF595E"]
    n16->n17 [color="#FF595E"]
    n19 [label=x]
    n16->n19
    n15 [label=< <B>FunctionCall</B><BR/>लेख >, color="#FF595E", fontcolor="#FF595E"]
    n15->n16 [color="#FF595E"]
    n20 [label=x]
    n15->n20
    n14 [label=< <B>Statement<BR/>3</B> >, color="#FF595E", fontcolor="#FF595E"]
    n14->n15 [color="#FF595E"]
    n21 [label=x]
    n14->n21
    n8 [label=< <B>If</B> >, color="#FF595E", fontcolor="#FF595E"]
    n8->n9 [label=condition]
    n8->n14 [label=if]
    n7 [label=< <B>Statement<BR/>2</B> >, color="#274690", fontcolor="#274690"]
    n7->n8 [color="#FF595E"]
    n25 [label=x]
    n7->n25
    n0 [label=< <B>Statement<BR/>1</B> >, color="#274690", fontcolor="#274690"]
    n0->n1 [color="#FF595E"]
    n0->n7 [color="#274690"]
}
After the code was working, I wrote a Makefile that saves the output, generates a PNG image of the graph and opens that image in the feh image viewer.
test_ast: parser/parser.C parser/parser.h tests/parser/parser.C lexer/lexer.C lexer/token.C lexer/characters.C
    $(CC) $(CFLAGS) parser/parser.C parser/ast.C parser/helper.C tests/parser/parser.C lexer/characters.C lexer/token.C lexer/lexer.C file_handler/file_handler.C -o tests/parser/parser.out
    @echo "Starting Parser Test"
    @echo
    @tests/parser/parser.out > .graph
    dot -Tpng < .graph > .png
    feh .png
    @echo
This makefile simply redirects the DOT output from STDOUT to a file, and uses
the graphviz program dot to generate a image that can be opened with feh.
Results
After the set up, the whole thing just fit into my workflow.
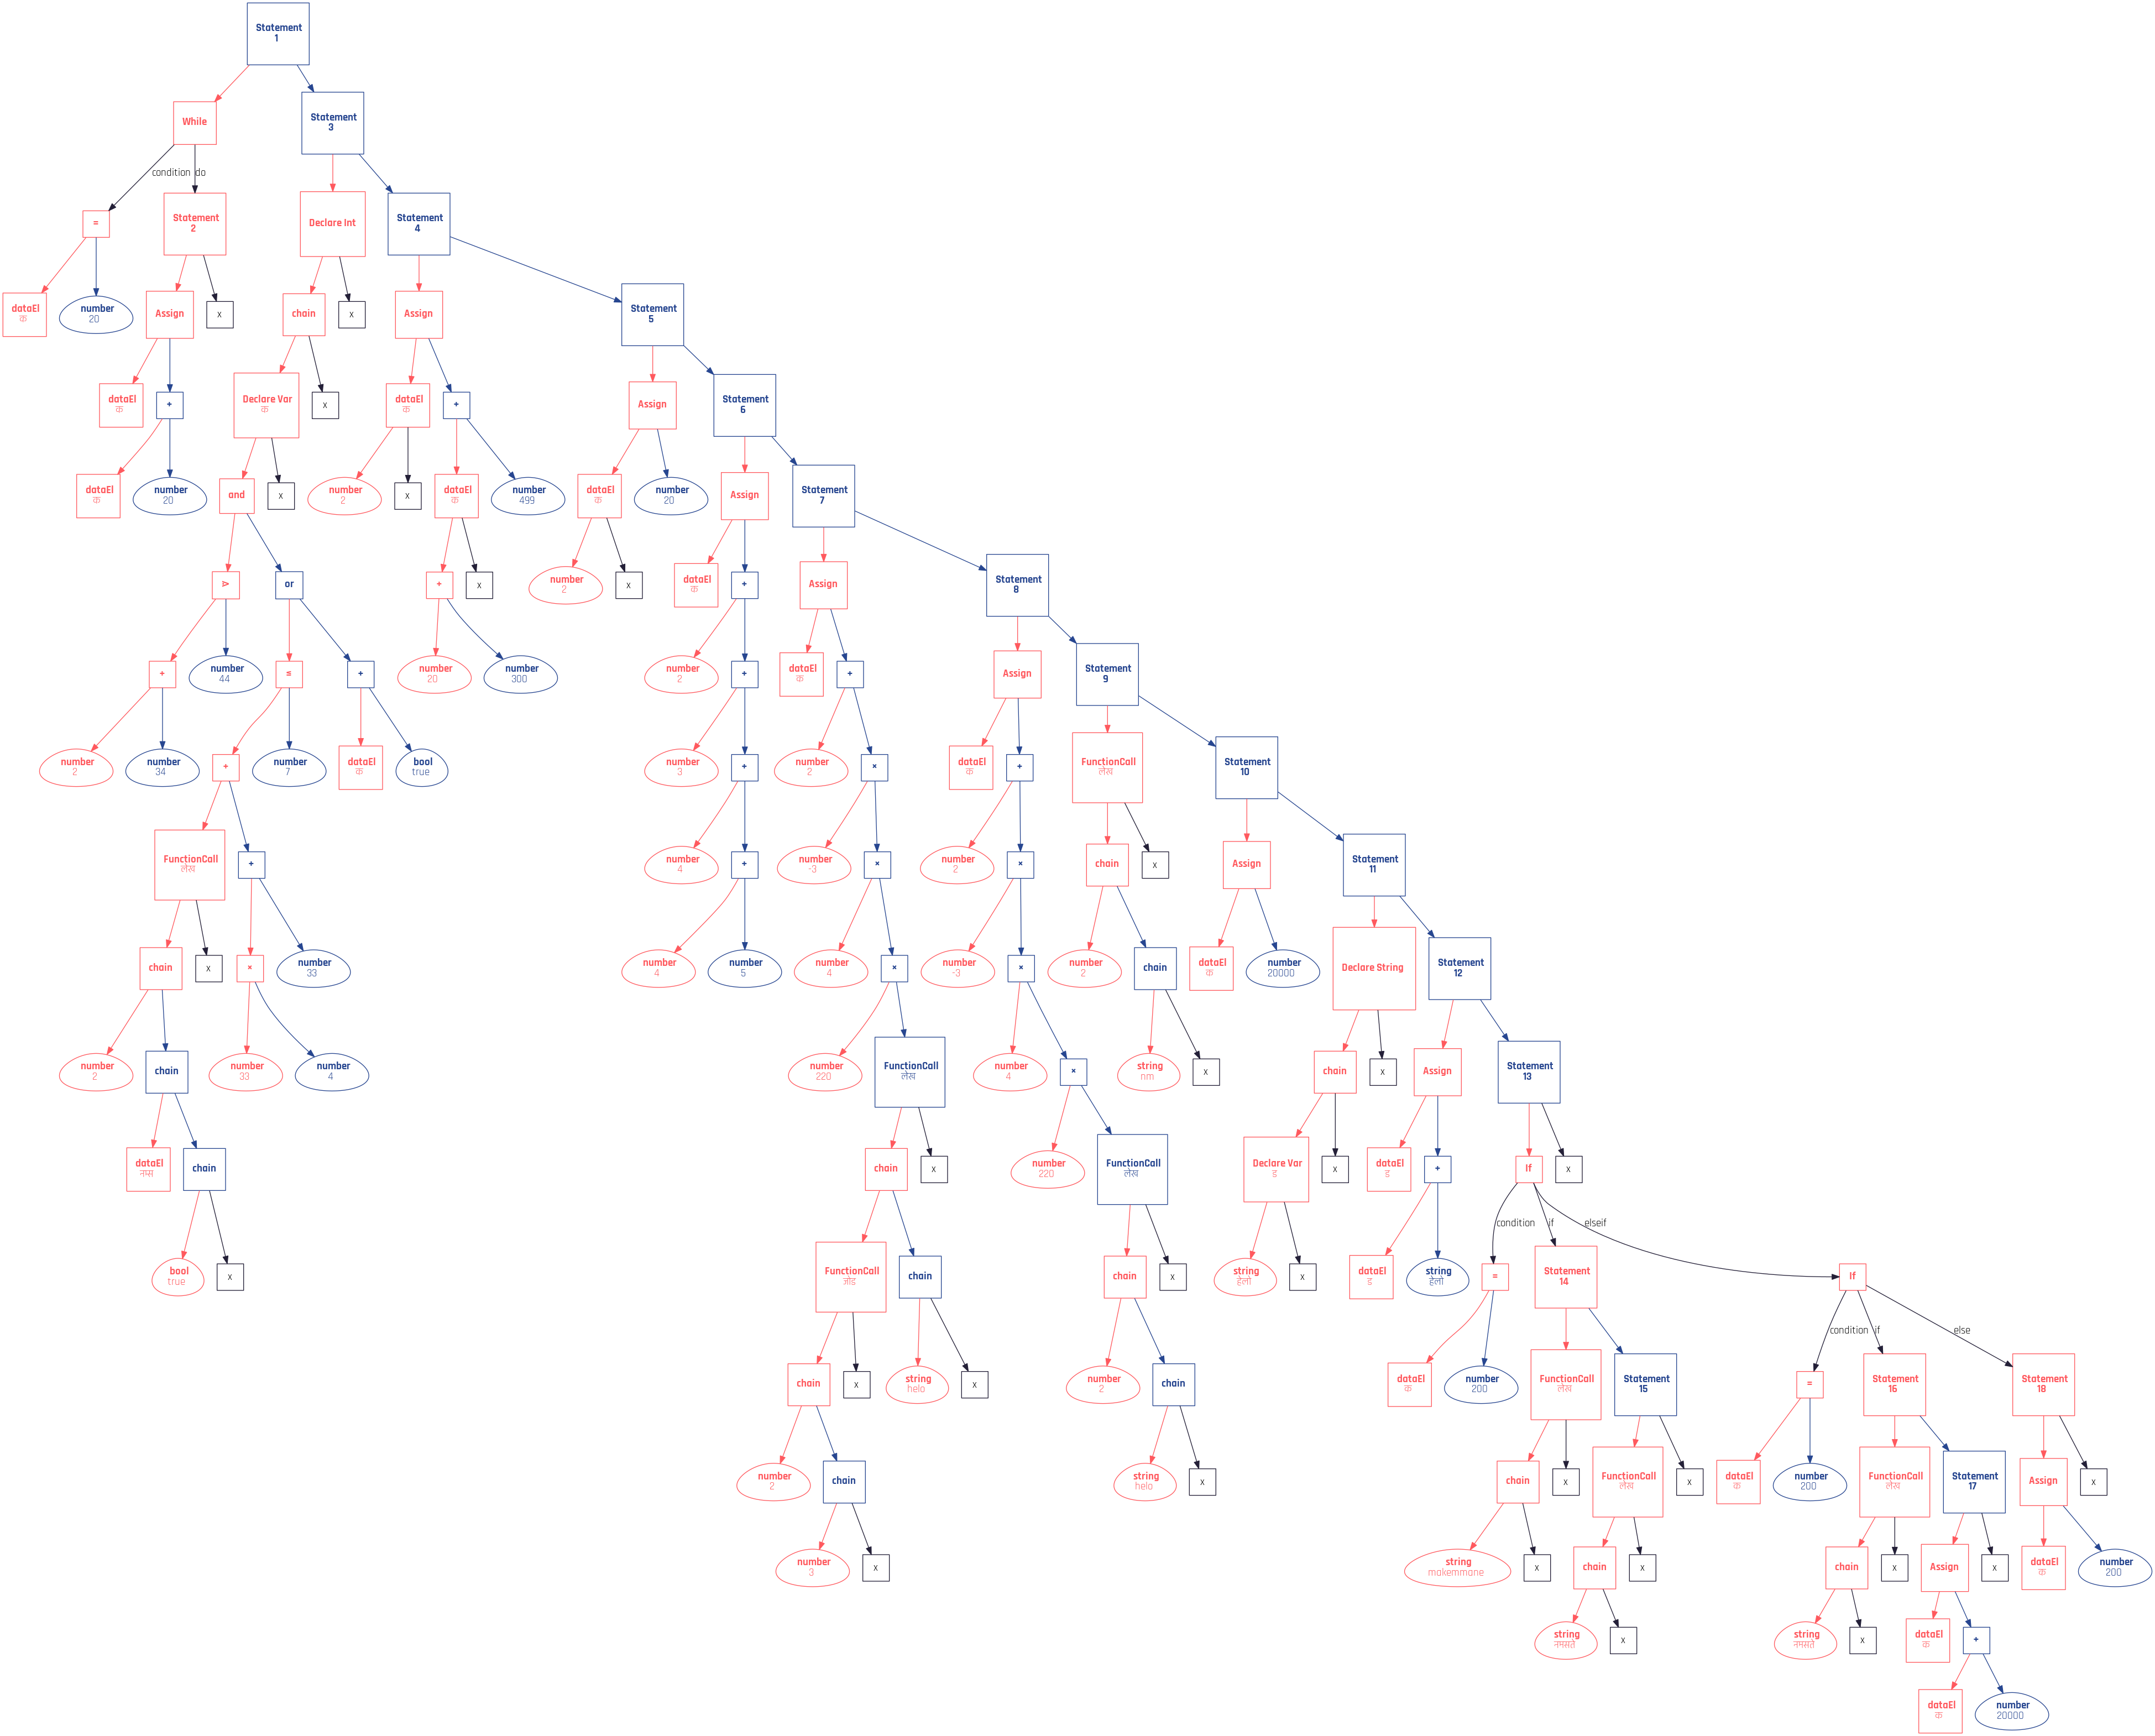
Here's an example graph generated from the makefile.
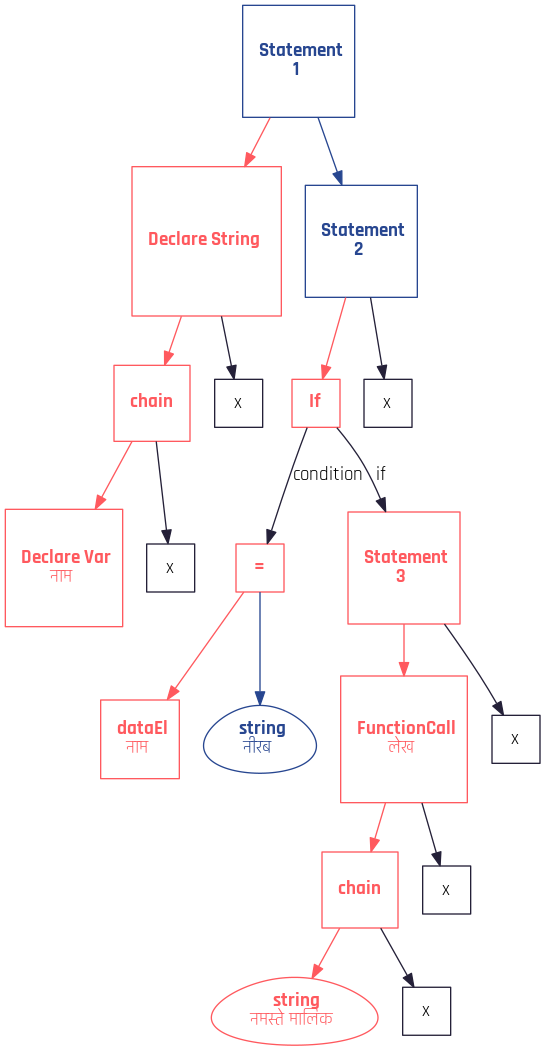
So the next time you're trying to debug or inspect a complex data structure or a tangle of pointers, try taking some time out to write code which generates DOT so that you can inspect the graph. I tell you, a picture is worth a thousand words. The AST below is worth much more: